

Start with the right scope
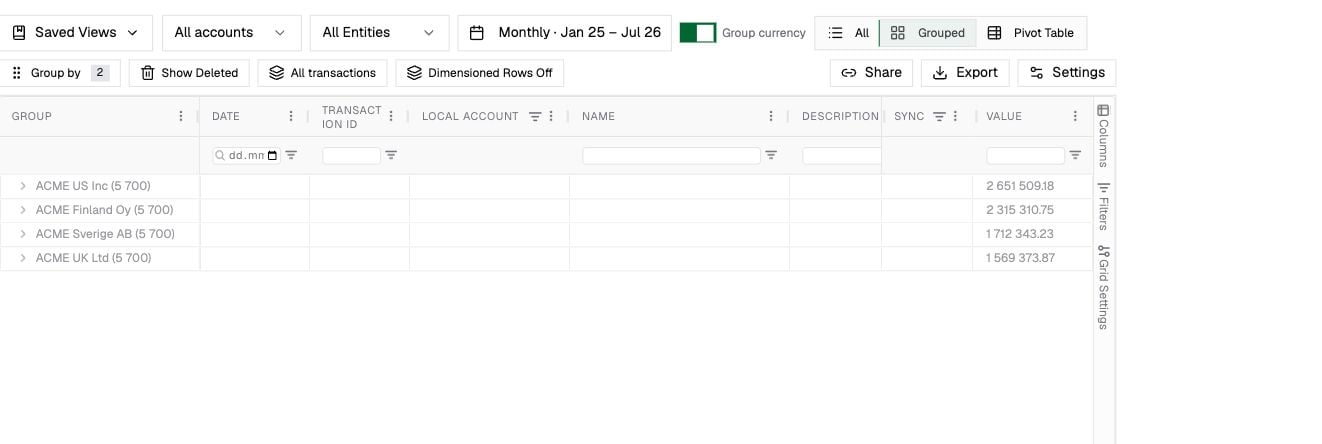
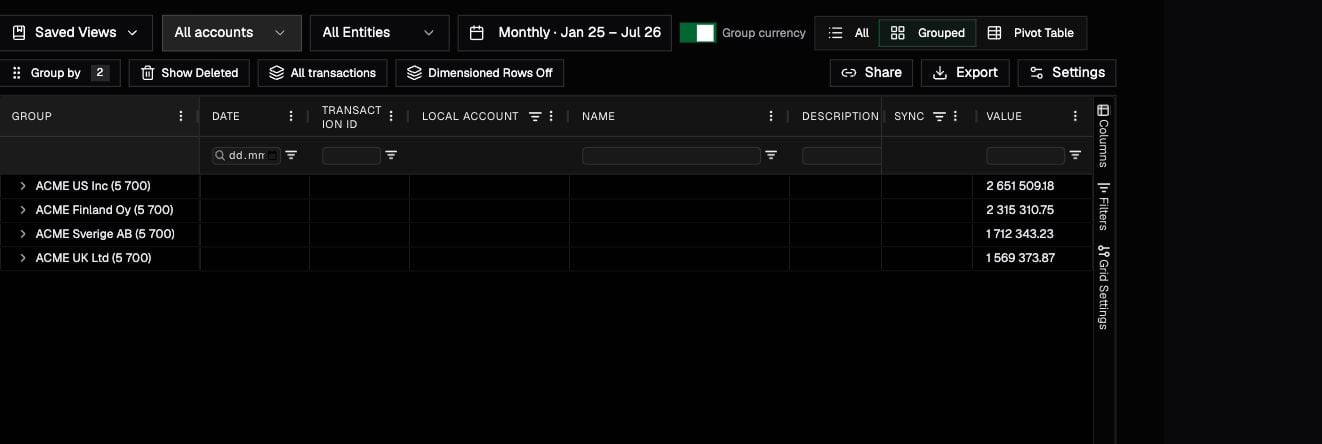
Open the Transactions Browser directly to browse across the available data, or open it from a financial-statement value to carry that value’s account and reporting context into the grid. Set the broad scope with the controls above the grid:- choose the accounts or reporting layout;
- select one or more entities;
- set the period and period granularity;
- turn Group currency on when values should be converted to the group currency;
- choose which transaction categories and deleted transactions to include.
Choose a grid view
The grid uses server-side pagination and aggregation. In All, the visible page may contain only part of the filtered result. Grouped and Pivot Table calculate their totals from the complete matching scope rather than only the rows currently visible.
Group and aggregate transactions
- Choose Grouped.
- Open Group by.
- Select one or more grouping fields, such as entity, group account, local account, dimension, period, or counterparty.
- Use the arrows to set the grouping order.
- Expand a group to move from its summed value to the next level and, ultimately, the transactions behind it.
Build a pivot table
- Choose Pivot Table.
- Open the Columns panel on the right side of the grid.
- Add fields to the row groups and column labels.
- Keep the transaction value as the aggregated measure.
- Expand row groups or adjust filters until the table answers the comparison you need.
Work with dimension allocations
Leave Dimensioned Rows off when one row per accounting transaction is sufficient. Turn it on when you need the dimension allocations behind each transaction. One source transaction can then appear on multiple rows, so reconcile the transaction value rather than comparing raw row counts between the two modes.Save, share, or export the result
- Use Saved Views to return to a useful combination of scope, filters, grid mode, grouping, and column settings.
- Use Share to copy a link to the current analysis.
- Use Export to download CSV or Excel, create a summary report, or copy all matching rows to the clipboard.